
Muda is the Japanese word meaning futility, idleness, waste.
Anything that doesn't add value to a process is wasteful.
Identifying waste is critical to Lean practice - the 3M wastes include Muda, Mura, Muri
Identifying waste is critical to Lean practice - the 3M wastes include Muda, Mura, Muri
u


Muda
Muda (waste) is any activity that doesn't add value to a process or product. The 8 wastes in Lean are:

- Transportation - movement of material
- Inventory - use of space and funds to hold inventories of material
- Motion - movement of people
- Waiting - queuing or scheduled delays
- Overproduction - producing more than necessary – in lab terms this could be media, buffer or other reagents
- Over processing: excess work or checks in process
- Defects: work (samples) that needs correcting or repeating
- Skills - unused talent or potential
Mura
 Mura (unevenness) is the waste associated with variations in work loads - a common occurrence in labs! Samples delivered and analysed in large batches impedes continuous flow. Lab workloads are volatile and are characterised by peaks and troughs. Imbalanced workloads negatively impact productivity and reduce lead time performance. Balancing the workload is an essential aspect of lean implementation to create a continuous flow rate. This can be achieved by levelling incoming samples by implementing a queue system at the start of the process with gradual release of samples to the lab. In biopharma, the sample flow rate is determined by production - lean manufacturing is necessary to alleviate Mura however it is not always possible due to batch processing is and queueing is dependent on sample stability.
 |
| The effect of unevenness and instability on lab productivity |
Muri
Muri (overburden) is the overloading of people or equipment. Muri is often directly caused by unevenness (Mura) when lab analysts are overloaded by peaks in the workload. Muri can be alleviated by effective resource scheduling levelling the workload to meets demands.

 Mura, Muda and Muri operate in synchrony. Eliminating one also eliminates the others. Identifying all aspects of waste is critical to lean implementation. Value Stream Mapping (VSM) is a powerful tool for process improvement. Similarly, statistical process control charts can help evaluate process efficiencies and identify 'special causes' or anomalies within a process. SPC charts can help assess variations within a process. It is most applicable to upstream and downstream bioprocessing, however SPC can also be effective in evaluating throughput efficieincies in laboratory sampling and may be valuable in detecting variation in analytical processes. Check out the case study Statistical Process Control (SPC) and Catalent.
Process Control Chart
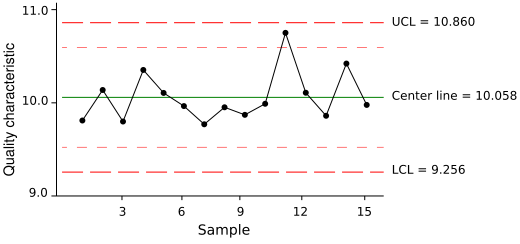 |
SPC chart outlining the upper (UCL) and lower (LCL) control limits. Generally time or sample number is on the X axis and analytical or process parameter on the Y axis |
No comments:
Post a Comment